
- Startseite >
- Flüsse >
- Abfluss >
- Iller - Lech - Bodensee >
- Fischach >
- Jahresgrafik

Jahresgrafik Fischach / Schmutter
Abfluss vom 24.05.2021 bis zum 23.05.2022
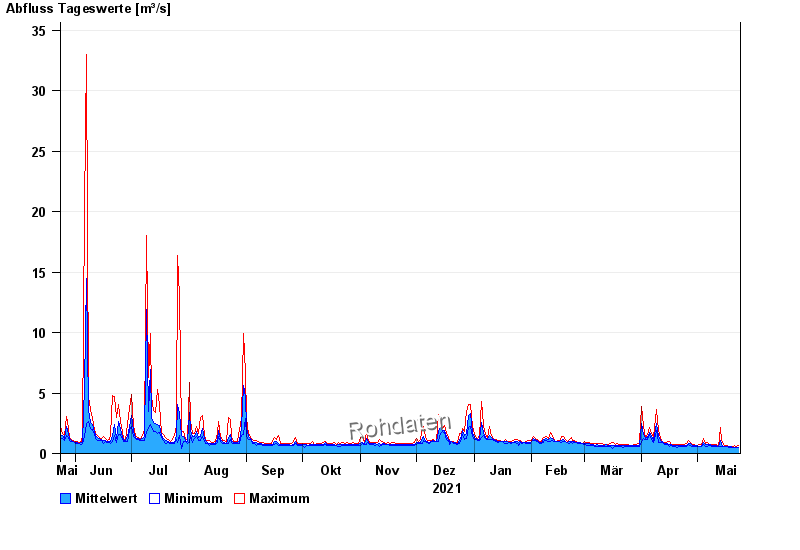
| Datum | Mittelwert [m³/s] | Maximum [m³/s] | Minimum [m³/s] |
|---|---|---|---|
| 23.05.2022 | 0,533 | 0,668 | 0,478 |
| 22.05.2022 | 0,522 | 0,616 | 0,478 |
| 21.05.2022 | 0,534 | 0,668 | 0,478 |
| 20.05.2022 | 0,517 | 0,567 | 0,478 |
| 19.05.2022 | 0,541 | 0,567 | 0,478 |
| 18.05.2022 | 0,561 | 0,616 | 0,521 |
| 17.05.2022 | 0,606 | 0,668 | 0,567 |
© Bayerisches Landesamt für Umwelt 2024