
- Startseite >
- Flüsse >
- Abfluss >
- Bayern >
- Bärenthal >
- Jahresgrafik

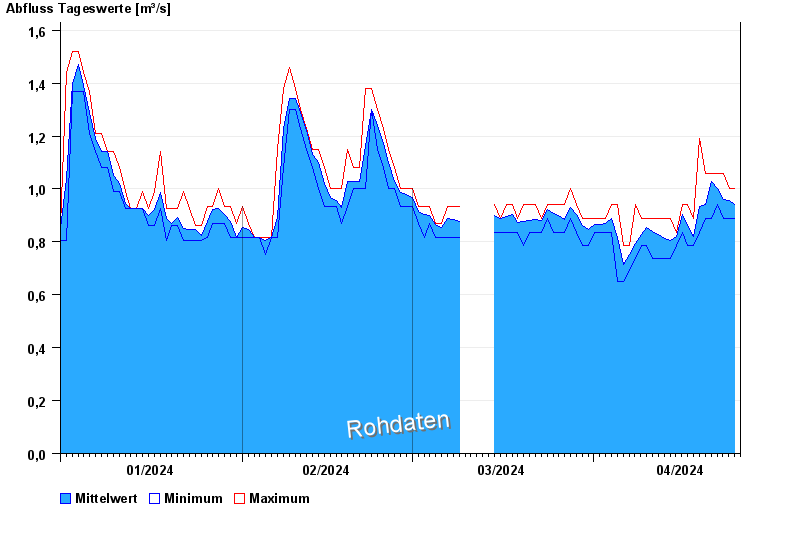
Jahresgrafik Bärenthal / Trubach
Abfluss vom 01.01.2024 bis zum 25.04.2024
Hinweis
Absinken des Wasserstandes wegen Entfernung von Auflandungen.
| Datum | Mittelwert [m³/s] | Maximum [m³/s] | Minimum [m³/s] |
|---|---|---|---|
| 25.04.2024 | 0,951 | 1 | 0,94 |
| 24.04.2024 | 0,955 | 1 | 0,89 |
| 23.04.2024 | 0,959 | 1,06 | 0,89 |
| 22.04.2024 | 1 | 1,06 | 0,94 |
| 21.04.2024 | 1,03 | 1,06 | 0,89 |
| 20.04.2024 | 0,941 | 1,06 | 0,89 |
| 19.04.2024 | 0,935 | 1,19 | 0,835 |
© Bayerisches Landesamt für Umwelt 2024