
- Startseite >
- Flüsse >
- Abfluss >
- Bayern >
- Aitrach KW >
- Jahresgrafik

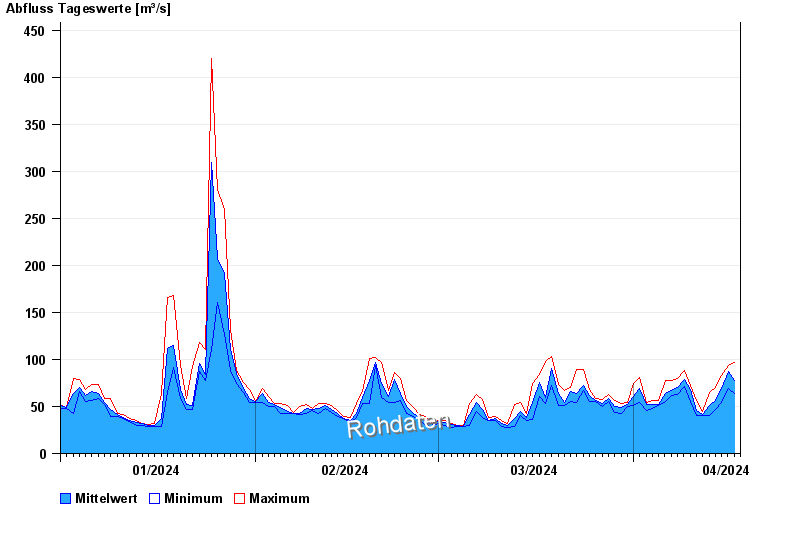
Jahresgrafik Aitrach KW / Iller
Abfluss vom 01.01.2024 bis zum 17.04.2024
 Für diesen Pegel sind keine Hauptwerte hinterlegt.
| Datum | Mittelwert [m³/s] | Maximum [m³/s] | Minimum [m³/s] |
|---|---|---|---|
| 17.04.2024 | 68,2 | 81,3 | 64,1 |
| 16.04.2024 | 87 | 94 | 69,1 |
| 15.04.2024 | 69 | 82,9 | 54 |
| 14.04.2024 | 56,2 | 70,1 | 46,9 |
| 13.04.2024 | 51,4 | 65,2 | 40,9 |
| 12.04.2024 | 41,7 | 45,1 | 40 |
| 11.04.2024 | 46,2 | 56 | 40,9 |
© Bayerisches Landesamt für Umwelt 2024